
Figures as Evidence: Multi-Image Scientific Generation
Jawad Ibn Ahad*, Mritunjoy Chakraborty*, Fuad Rahman, Sifat Momen, Shafin Rahman, Nabeel Mohammed
✅ Accepted at 20th International Conference on Document Analysis and Recognition (ICDAR 2026)
📄 Paper: Yet to publish
🏛 Affiliation: Apurba-NSU R&D Lab, Department of ECE, North South University, Dhaka, Bangladesh
🤝 Equal Contribution: Jawad Ibn Ahad*, Mritunjoy Chakraborty* (* Equal contribution)
💰 Grant: NSU CTRGC Research Grant [CTRG-24-SEPS-12]
Abstract
Scientific documents present a fundamental challenge for automated understanding: key findings are distributed across multiple figures, tables, and captions that must be interpreted collectively rather than independently. We propose a structured multimodal pipeline for section-level scientific content generation that jointly reasons over multiple figures within a document section — including Methodology, Exploratory Data Analysis, Results, and other visually grounded sections. Instead of processing figures individually, we introduce a deterministic visual canonicalization strategy that aggregates all figures in a section into a unified composite representation, enabling cross-figure reasoning while maintaining fixed computational complexity. A fixed-token compression mechanism transforms high-resolution visual inputs into a compact visual prefix, ensuring constant-length conditioning regardless of the number of figures. This design mitigates the quadratic computational growth typically associated with multi-figure inputs and allows scalable long-form generation using standard generative transformers. We evaluate the proposed framework on CoCoOne, a benchmark comprising 668 scientific papers across Agriculture, Environment, and Atmosphere domains with over 10,000 figure–text pairs. Across multiple vision–language backbones, the approach achieves consistent improvements in lexical overlap, semantic alignment, and structural completeness.
Introduction
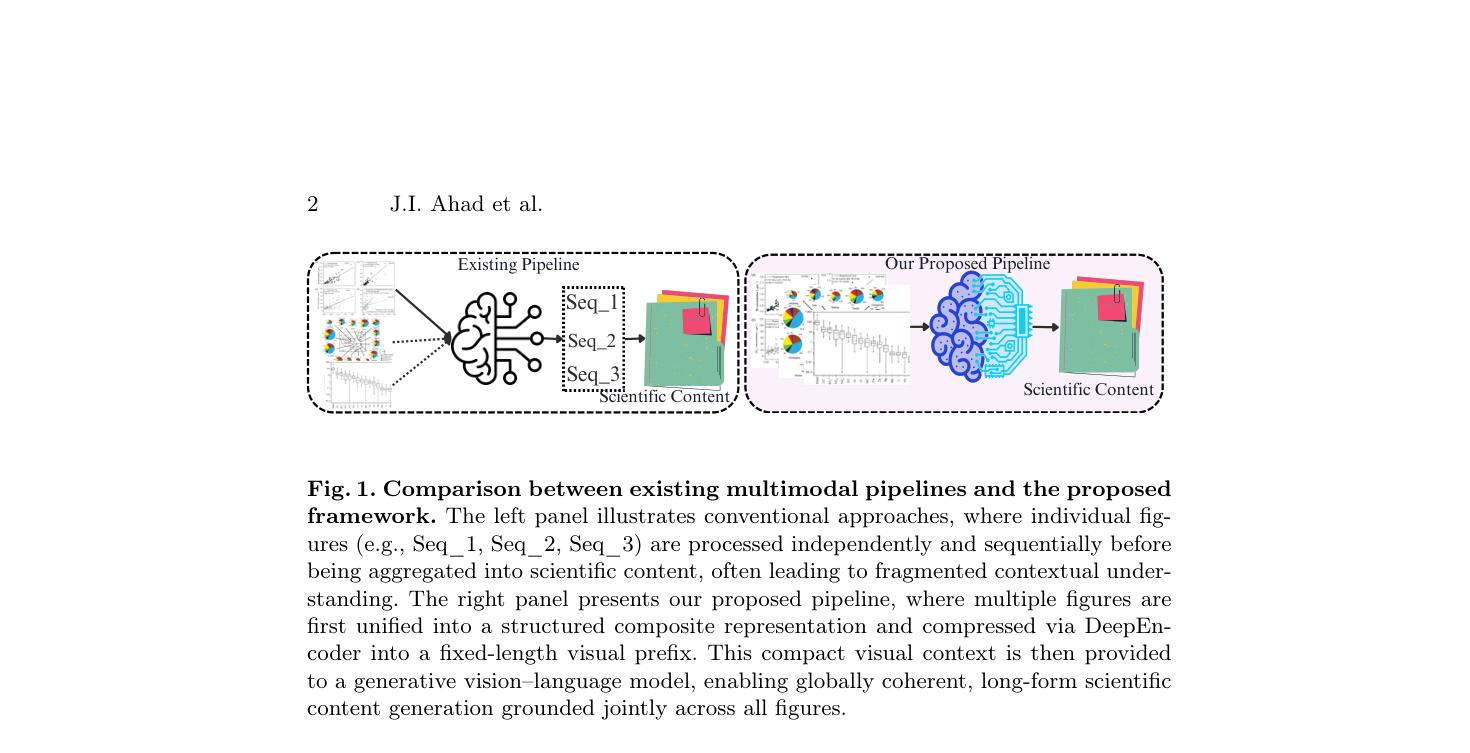
Figure 1: Comparison between existing multimodal pipelines and the proposed framework. Left: conventional approaches process individual figures (Seq_1, Seq_2, Seq_3) independently and sequentially before aggregating into scientific content — leading to fragmented contextual understanding. Right: our proposed pipeline first unifies multiple figures into a structured composite representation, compresses it via DeepEncoder into a fixed-length visual prefix, and provides it to a generative VLM for globally coherent, long-form scientific content generation grounded jointly across all figures.
Existing multi-figure approaches face three key limitations:
- (a) Fixed token expansion per image causes visual token count to grow linearly with number of figures, leading to quadratic attention cost and high memory use.
- (b) Independently encoded images provide limited structured alignment across figures, forcing the language model to infer cross-figure relationships implicitly.
- (c) Independent tokenization can introduce redundant visual tokens and fragmented grounding, causing long-form outputs to miss cross-references or lose narrative consistency.
🎯 Key Contributions
- Structured Multi-Figure Canonicalization — A deterministic grid-based visual canonicalization strategy that transforms a variable number of figures and tables into a unified 1024×1024 composite representation, enabling joint cross-figure reasoning without modifying the vision–language architecture.
- Fixed-Length Visual Prefix Compression — A fixed-length visual compression framework converting high-resolution multi-figure inputs into a compact 256-token visual prefix — constant computational cost regardless of the number of input figures.
- Architecture-Agnostic Evaluation — Evaluated across multiple VLM backbones (Qwen2.5-VL-7B, InternVL-7B, LLaVA-1.5-7B), domain splits, ablation settings, and external multimodal summarization benchmarks (MMSS, MSMO, M3LS, OASum) without benchmark-specific fine-tuning.
Methodology
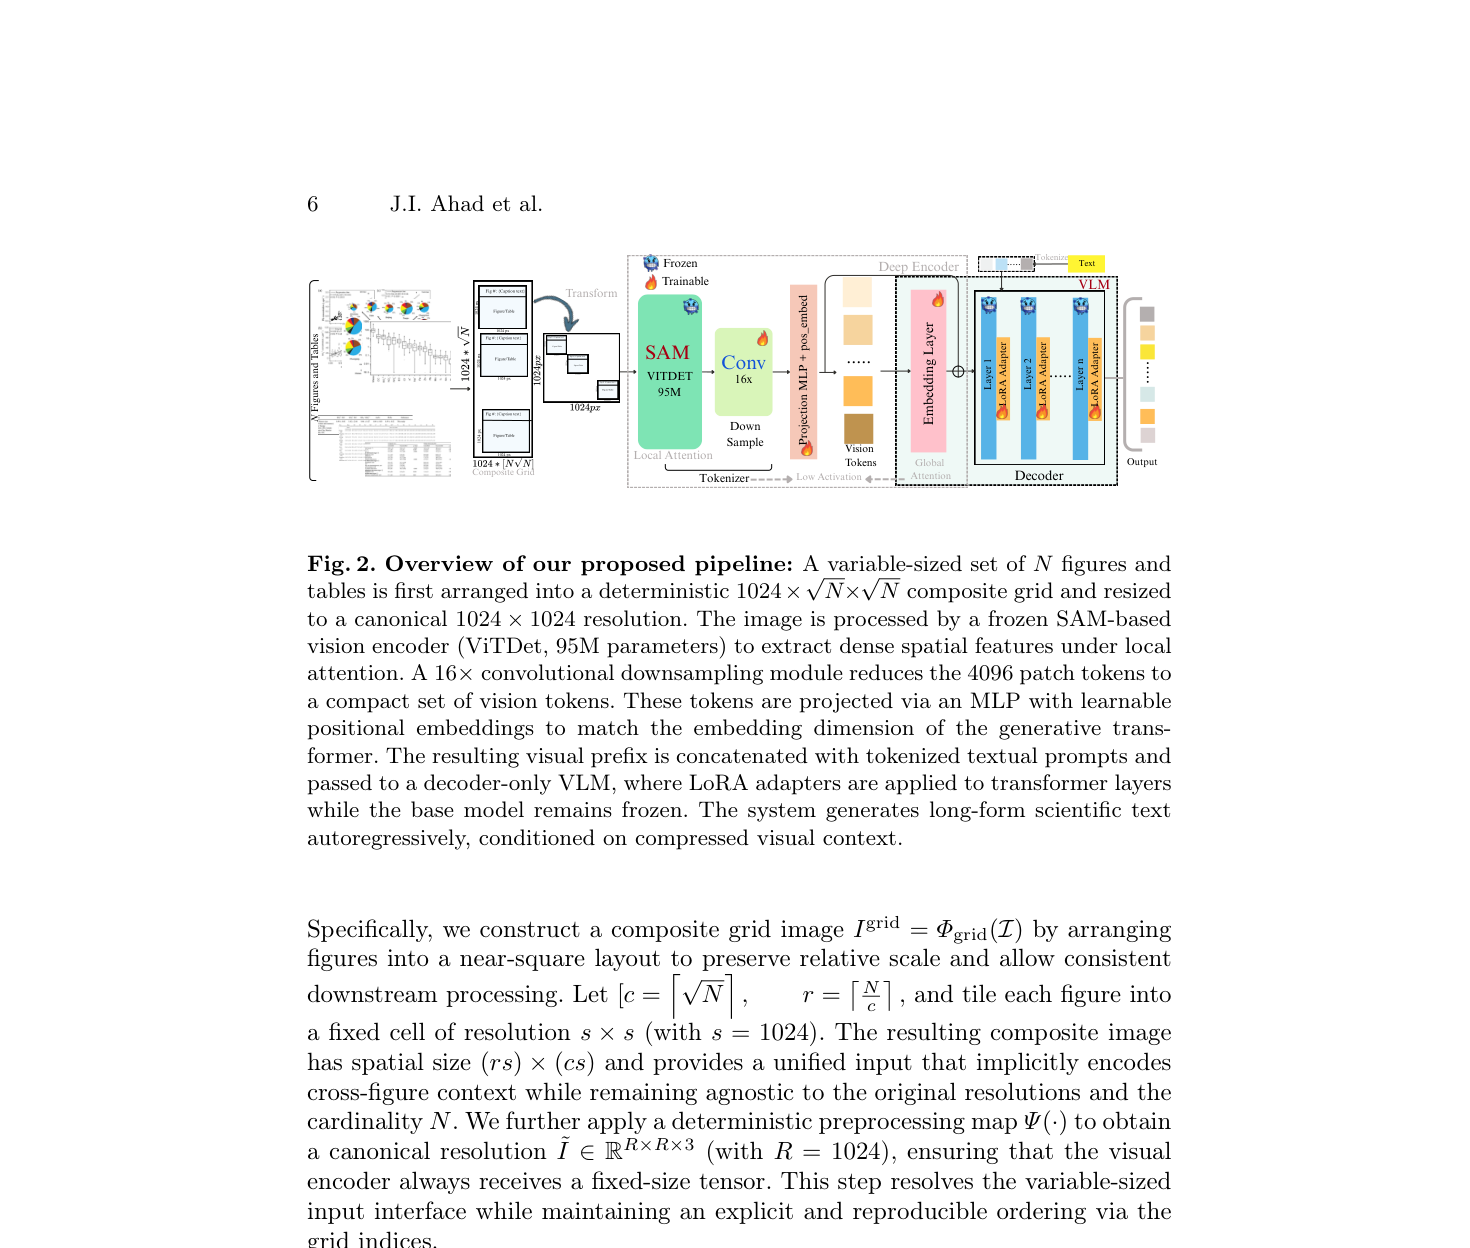
Figure 2: Overview of the proposed pipeline. A variable-sized set of N figures and tables is arranged into a deterministic 1024×⌈√N⌉×⌈√N⌉ composite grid and resized to 1024×1024. The image is processed by a frozen SAM-based vision encoder (ViTDet, 95M) to extract dense spatial features under local attention. A 16× convolutional downsampling module reduces 4096 patch tokens to 256 vision tokens. Tokens are projected via MLP + learnable positional embeddings to match the decoder embedding dimension. The resulting visual prefix is concatenated with tokenized prompts and passed to a decoder-only VLM with LoRA adapters, generating long-form scientific text autoregressively.
Problem Formulation
Let I = {Iᵢ}ᴺᵢ₌₁ be a variable-sized set of figures, each Iᵢ ∈ ℝ^{Hᵢ×Wᵢ×C}. Let Y = (y₁,…,yₜ) be a long-form textual sequence. The objective is to learn:
\[p_\theta(\mathcal{Y} \mid \mathcal{I}) = \prod_{t=1}^T p_\theta(y_t \mid y_{<t}, \mathcal{I})\]Multi-Figure Canonicalization
For N input figures, construct composite grid image I^grid = Φ_grid(I):
- Grid size: c = ⌈√N⌉ columns, r = ⌈N/c⌉ rows
- Each figure resized to s×s (s=1024) per cell
- Final composite resized to canonical 1024×1024
Optical Token Compression (DeepEncoder)
\[Z = \mathcal{E}_v(\tilde{I}) \in \mathbb{R}^{N_p \times d_v}, \quad N_p = \left(\frac{R}{16}\right)^2 = 4096\] \[Z \in \mathbb{R}^{4096 \times 256} \;\mapsto\; Z_c = \mathcal{C}(Z) \in \mathbb{R}^{256 \times 256}, \quad N_c = \frac{4096}{16} = 256\]Achieved via adaptive average pooling — 16× token reduction, fixed regardless of N.
Modality Alignment & Prefix Construction
Alignment MLP: P: ℝ^256 → ℝ^{dℓ} (applied token-wise)
\[V^\star = V + \mathcal{P}, \qquad H_0 = \text{Concat}(V^\star,\, E(X)) \in \mathbb{R}^{(N_c + T_p) \times d_\ell}\]Training
- Backbone VLMs: Qwen2.5-VL-7B, InternVL-7B, LLaVA-1.5-7B
- LoRA: rank r=16, ~5.6×10⁸ trainable params (~7% of model)
- Optimizer: 8-bit AdamW — lr=2×10⁻⁵ (transformer), 5×10⁻⁵ (visual projection)
- Weight decay: 0.05 · Gradient clipping: 1.0 · Cosine scheduling · Warmup: 150 steps
- Inference: Nucleus sampling (p=0.9), temperature=0.7, repetition penalty=1.15, 1500–2500 words/document
- Hardware: Single NVIDIA RTX 5090 GPU
📊 Datasets
Table 1: CoCoOne Dataset Statistics (3 Domain Splits)
| Split | Papers | Figures | Tables | Results Sec. Length (Min) | Results Sec. Length (Max) | Caption Length (Min) | Caption Length (Max) |
|---|---|---|---|---|---|---|---|
| Atmosphere | 111 | 355 | 177 | 5,132 | 60,469 | 33 | 875 |
| Environment | 106 | 165 | 305 | 204 | 32,147 | 15 | 1,192 |
| Agriculture | 451 | 696 | 1,285 | 1,260 | 32,046 | 32 | 2,229 |
| Total | 668 | 1,216 | 1,767 | — | — | — | — |
Content extracted exclusively from Results and Analysis sections. Tables represented as rendered images.
📊 Results
Table 2: Baseline Model Scale and Training Regime
| Model | Architecture | Params | Training Data | Dataset Size |
|---|---|---|---|---|
| MAtt | BiGRU + VGGNet | ~30M | MMSS | ~66K |
| MSMO | BERT + Transformer Decoder | ~110M | MSMO | ~314K |
| CFSum | BART-large | ~400M | MMSS + MSMO | ~66K / ~314K |
| DIUSum | BertAbs + CLIP Scorer | ~110M + frozen CLIP | MMSS + MSMO | ~66K / ~314K |
| Uni. MSMO | mBART-based | ~611M | M3LS | >1M pairs |
| BART-base | BART-base | ~140M | OASum | ~3.7M triplets |
| BART-MMSS | BART-large + CNN fusion | ~400M | MMSS | ~66K |
| Ours | VLM + LoRA | 7B; ~560M trainable | CoCoOne | 668 papers |
Our model is trained only on CoCoOne and evaluated zero-shot on MMSS, MSMO, M3LS, OASum — no benchmark-specific fine-tuning.
Table 3: Performance Across Backbone VLMs and Domain Splits
⃝ = Qwen2.5-VL-7B · □ = InternVL-7B · △ = LLaVA-1.5-7B. Bold = best, underline = second best per split.
| Split | Model | BLEU-1 | BLEU-4 | ROUGE-1 | ROUGE-2 | ROUGE-L | BERT F1 | Len. Ratio | METEOR | Cosine Sim. | Avg. |
|---|---|---|---|---|---|---|---|---|---|---|---|
| Atm | ⃝ | 0.62 | 0.41 | 0.53 | 0.34 | 0.49 | 0.88 | 0.72 | 0.31 | 0.78 | 0.564 |
| □ | 0.58 | 0.36 | 0.49 | 0.29 | 0.45 | 0.86 | 0.69 | 0.27 | 0.74 | 0.526 | |
| △ | 0.55 | 0.34 | 0.47 | 0.27 | 0.43 | 0.85 | 0.66 | 0.26 | 0.72 | 0.506 | |
| Env | ⃝ | 0.64 | 0.39 | 0.55 | 0.35 | 0.51 | 0.89 | 0.74 | 0.32 | 0.79 | 0.576 |
| □ | 0.59 | 0.37 | 0.52 | 0.31 | 0.48 | 0.87 | 0.71 | 0.28 | 0.76 | 0.543 | |
| △ | 0.56 | 0.33 | 0.46 | 0.26 | 0.42 | 0.85 | 0.67 | 0.25 | 0.71 | 0.501 | |
| Agri | ⃝ | 0.61 | 0.40 | 0.54 | 0.33 | 0.50 | 0.88 | 0.73 | 0.30 | 0.77 | 0.562 |
| □ | 0.57 | 0.35 | 0.48 | 0.28 | 0.44 | 0.86 | 0.70 | 0.27 | 0.73 | 0.520 | |
| △ | 0.54 | 0.32 | 0.45 | 0.25 | 0.41 | 0.85 | 0.65 | 0.24 | 0.70 | 0.490 |
Qwen2.5-VL-7B achieves the highest average (0.564–0.576) across all splits. Largest gains are in BERTScore and Cosine Similarity — indicating stronger contextual grounding. Performance is stable across domain shifts, confirming architecture-agnostic robustness.
Table 4: Cross-Benchmark Generalization (Zero-Shot on External Datasets)
R1/R2/RL = ROUGE-1/2/L (×100) · BS = BERTScore F1. Existing baselines trained on their target benchmarks; ours is zero-shot.
| Model | MMSS R1/R2/RL/BS | MSMO R1/R2/RL/BS | M3LS R1/R2/RL/BS | OASum R1/R2/RL/BS |
|---|---|---|---|---|
| MAtt | 46.13/23.41/43.21/— | — | — | — |
| CFSum | 47.86/25.64/44.64/— | 43.10/18.60/40.10/— | — | — |
| DIUSum | 49.35/26.80/46.12/0.892 | 43.04/18.42/40.03/0.873 | — | — |
| MSMO BertAbs | — | 41.85/17.33/38.72/— | — | — |
| T5-base | — | — | 35.20/14.82/32.10/— | — |
| Unified MSMO | — | — | 38.60/16.94/35.43/0.841 | — |
| BART-base | — | — | — | 37.80/16.44/33.90/— |
| BART-MMSS | — | — | — | 40.12/17.98/36.80/0.845 |
| Qwen2.5-VL-7B (Ours) | 45.55/21.22/44.56/0.885 | 43.01/16.33/36.15/0.850 | 35.12/11.15/28.55/0.822 | 38.55/15.45/34.55/0.835 |
Despite zero-shot evaluation, our model approaches SOTA ROUGE scores while achieving the highest BERTScore on MMSS and MSMO, demonstrating strong cross-dataset generalization.
Table 5: Long-Form Quality and Cross-Dataset Generalization
(a) LLM-based Evaluation (1–5 scale: Coherence / Factual Consistency / Visual Grounding)
| Model | Coherence | Factual Consistency | Visual Grounding | Avg. |
|---|---|---|---|---|
| LLaVA-1.5-7B | 3.32 | 2.89 | 2.81 | 3.01 |
| InternVL-7B | 3.58 | 3.54 | 3.15 | 3.42 |
| Qwen2.5-VL-7B | 3.92 | 3.77 | 3.69 | 3.79 |
(b) Cross-Dataset Generalization — ROUGE-1 / BERTScore F1 (Qwen2.5-VL-7B)
| Train → | MMSS | MSMO | M3LS | OASum |
|---|---|---|---|---|
| MMS | 50.3/0.931 | 45.2/0.856 | 34.6/0.829 | 38.9/0.838 |
| MSMO | 44.8/0.898 | 48.9/0.922 | 35.2/0.851 | 36.5/0.861 |
| M3LS | 42.6/0.873 | 42.7/0.860 | 39.5/0.859 | 37.8/0.842 |
| OASum | 43.1/0.875 | 41.3/0.858 | 33.8/0.828 | 39.4/0.849 |
| CoCoOne (Ours) | 45.55/0.885 | 43.01/0.850 | 35.12/0.822 | 38.55/0.835 |
📊 Ablation Study
Table 6: Grid vs. Sequential Input and Reranker Selection
(a) Canonical Grid vs. Sequential Figure Processing
| Input | Figures | Tokens | ROUGE-L | Latency |
|---|---|---|---|---|
| Sequential | 2 | 1,224 | 24.1 | 1.2× |
| Grid | 2 | 256 | 24.2 | 1.0× |
| Sequential | 5 | 1,280 | 23.3 | 3.4× |
| Grid | 5 | 256 | 24.5 | 1.0× |
Grid maintains constant 256-token prefix and improves ROUGE-L from 23.3 → 24.5 with 5 figures while reducing latency from 3.4× → 1.0×.
(b) Reranker-Assisted Figure Selection (N > 6)
| Strategy | ROUGE-L |
|---|---|
| Naive grid | 21.8 |
| Reranker (top-5 cosine selection) | 23.1 |
Effect of Input Figures and Visual Token Budget
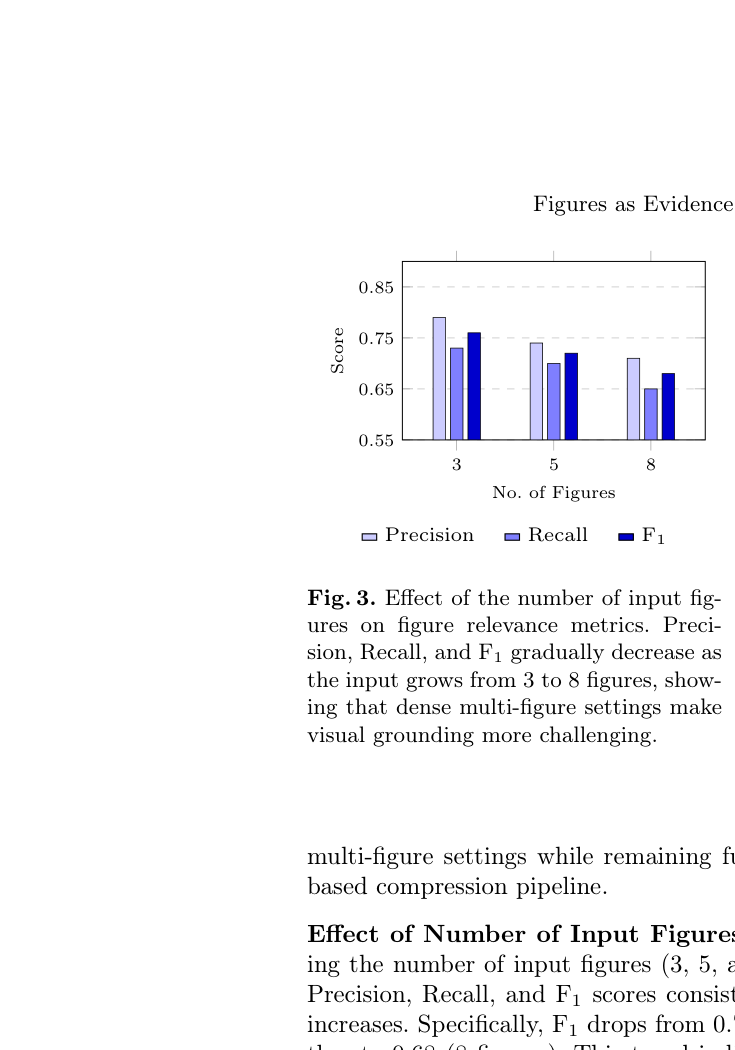
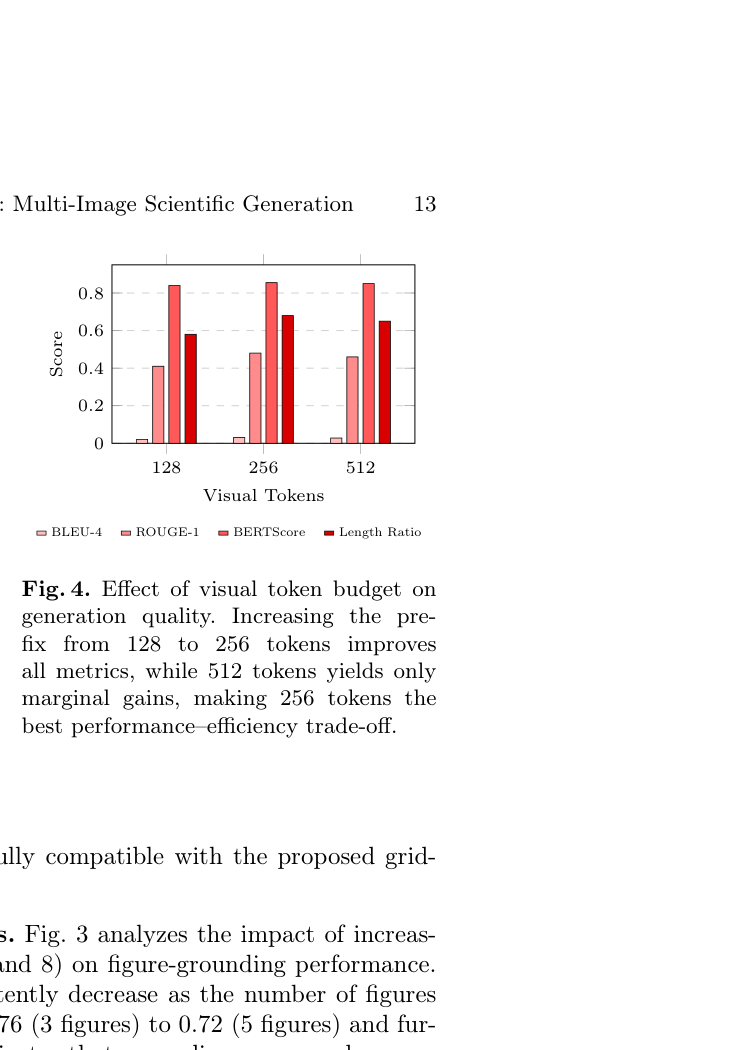
Figure 3 (left): Precision, Recall, and F1 gradually decrease as input grows from 3 to 8 figures (F1: 0.76 → 0.72 → 0.68), showing that dense multi-figure settings make visual grounding more challenging.
Figure 4 (right): Increasing the visual prefix from 128 to 256 tokens substantially improves all metrics. 512 tokens yields only marginal gains — 256 tokens is the optimal performance–efficiency trade-off.
📚 Citation
@inproceedings{ahad2026figures,
  title={Figures as Evidence: Multi-Image Scientific Generation},
  author={Ahad, Jawad Ibn and Chakraborty, Mritunjoy and Rahman, Fuad and Momen, Sifat and Rahman, Shafin and Mohammed, Nabeel},
  booktitle={20th International Conference on Document Analysis and Recognition (ICDAR)},
  year={2026},
  note={Yet to publish}
}